With the sheer amount of new digital content being published every day, marketers need to know what works and what doesn't. You can't afford to waste time and energy on content marketing that flops; the industry moves so fast and there's too much to do.
But how do you know when a post, eBook, or infographic is worth the blood, sweat, and coffee you pour into it? One of the ways we do it is with BuzzSumo, an app that keeps getting better and better.
When we last wrote about BuzzSumo, it was a helpful content measurement tool with a ton of potential. A little over a year later, BuzzSumo is so powerful and robust that it's a must-have for every content marketer in the business. Here's how BuzzSumo can help you easily measure and analyze your content:
Analyzing Your Content Marketing: Listen To The Numbers
Ever wonder how many shares your content gets? What about links? Or which social networks are best at driving visitors to your posts? You can see data like this, as far back as a year, by running a Content Analysis Report on your URL:

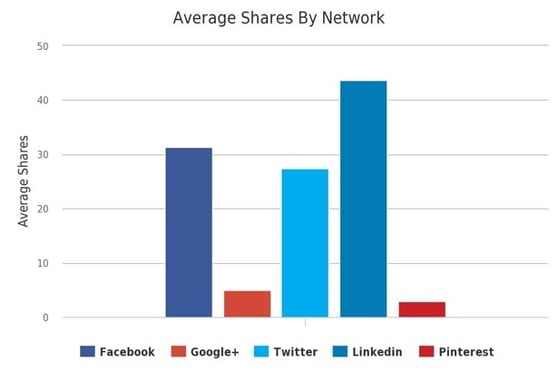
So, you want to know how many shares your posts usually generate and on which platforms? No problem:
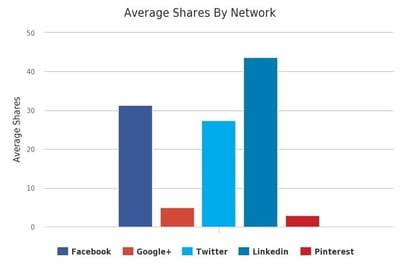
Over the last year, our posts have averaged around 110 shares each, at least across the five main social networks. We're getting the most traction on LinkedIn (40+ shares), Facebook (30+ shares), and Twitter (25+ shares). This chart is an excellent indicator if you don't have a general idea of where your audience hangs out in the digital space. The data here is also perfect for crunching the numbers on The One Metric (which is something we may explore in a later post, so stay tuned). Even taken at face value, these numbers give you an idea of where your content finds the most success.
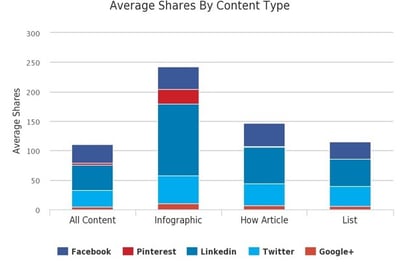
Knowing which types of content get shared at a higher than average rate is extremely useful information as you can create more of what works best (and, in turn, less of whatever underperforms). For example, in terms of WSI's content, we continue to develop monthly infographics because they continue to do well, but we also see that how-to articles and lists (our video entries) get shared more than our "average" piece of content.
The other exciting insight we can glean from this chart is that the average number of shares per platform stays consistent with the first chart, except for one instance: infographic shares on Pinterest, which exceed Google+ shares and are closer to Twitter's numbers than the average dictates. This all makes sense since Pinterest is a visual platform, but it shows you should add your own context and insight to these results. The overall number of average shares on Pinterest is low, but Pinterest is young, growing fast, and a perfect platform for graphics, which means there is an opportunity to increase our presence there.
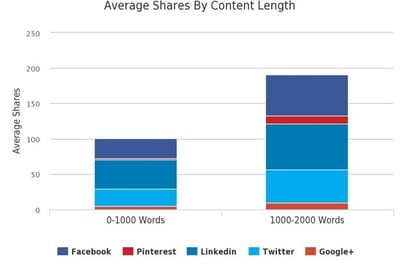
This is a fantastic chart, especially if you're an advocate of content marketing. WSI's posts that exceed 1000 words get shared almost twice as often as posts under 1000 words (which are shared fewer times than our average number of shares per post over the last year). Basically, our audience finds longer posts more shareable, presumably because the longer form allows them to include more information presented in an exciting and entertaining manner.
In more general terms, this data set shows us that you can't just throw up a few hundred words of basic content and expect to be successful, even though it's still a shockingly common occurrence in all corners of the digital world. Yes, quality is still better than quantity; you can't type up 1500 words of nonsensical drivel and win the Internet. But there are many limitations to a 300-word blog post, and the numbers certainly agree that more depth means more insight, relevance, and information.
For comparison's sake, let's take a look at the same content length chart for HubSpot, one of our partners (who could also be considered a competitor within the digital marketing blog space):
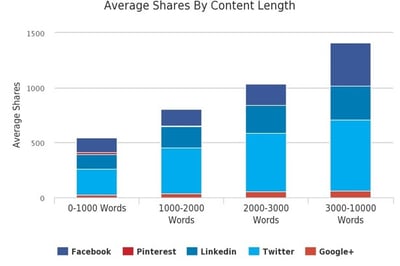
HubSpot's data shows a direct correlation between a post's length and the number of times it gets shared. As the number of words in a post increases, so do shares.
Look Under The Hood
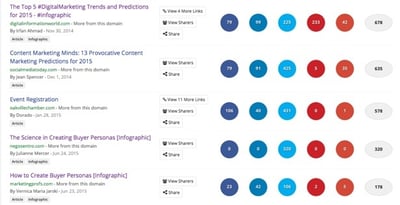
Another great aspect of BuzzSumo is its ability to give you a snapshot of the backlinks your most popular pieces of content are generating. I realize backlink information is available in many other tools, both free and paid, but it's nice to access all this information from the same place. The backlinks are also sorted by the highest number of shares per backlink source. Here's what the information looks like (and you can also export it to Excel or CSV):
Stay Alert
The final suggestion I have for how to measure and analyze your content is to stay up to date with the digital scene. BuzzSumo's Content Alerts feature allows you to keep pace by setting alerts for brand names, keywords, backlinks, or authors:

For example, I set a backlink alert for this domain (our website, WSIWorld.com), so now, anytime there's a new link coming to WSIWorld, I'll know about it as soon as it's discovered. This feature can be used in multiple ways, both to track our own content and activity, and that of our competitors. It can even be used to help with content curation; if I enter an author whom I know creates shareable content our audience wants to read, I'll immediately know when there's something new to distribute without having to look for it.
There are countless tools to measure content and social media activity (and there are probably more being developed as you read this). But sometimes keeping it simple is the most optimal route, and that's why we love BuzzSumo. It's easy to use and read, it has excellent reporting options, accessing data for an entire year is no problem, and you can set real-time data alerts. This is an easy way for most brands and marketers to measure and analyze content.