

With Christmas just around the corner, the holiday tunes are in full swing and the escapades of Clark Griswold and Kevin McCallister are endlessly replaying on our TVs. So let's get serious for a second and ask ourselves, as we do every year at this time, "Have I been naughty or nice?"
As the tradition goes, if you're on Santa's nice list, you'll get a fun Christmas present that rewards your good behaviour; if you're on the naughty list, you'll get a lump of coal that represents your mischievous year. The important thing from everybody to remember is that not only does Santa Claus always make his list - he checks it twice.
Santa Tracks and Measures - You Should Too
So what do Santa and Christmas have to do with your business? For starters, the big guy in the red suit can teach you that tracking and measuring is important, no matter what goal you're trying to accomplish. With Santa, it's determining whether a person falls into Category A or Category B, which is a pretty simple goal (and probably not all that hard to track if you picture a digital-savvy North Pole a la Arthur Christmas instead of what's depicted in Rudolph the Red-Nosed Reindeer). But the fact remains that Santa's whole operation revolves around tracking and measuring something - if it didn't, how would he know how many presents he needed? How would he know when to start making toys so the elves could meet their deadline of Christmas Eve? The short answer is that he wouldn't, and the North Pole - and Christmas - would be a mess.

Businesses and people often put themselves through a similar chaos by not setting goals and tracking and measure their level of achievement. Whether it's your digital marketing campaigns, weight loss or monthly entertainment spending money, you're not going to have very much success unless you set a target or a goal - and then that target or goal is completely useless unless you track your results.
If you're unfamiliar with the world of web analytics, you might be intimidated by the thought of measurement and the idea of complex tools, charts and graphs that go with it. But the truth is that it really can (and should, especially at first) be as simple as Santa's naughty or nice list. Whether it's more visitors per day, a lower bounce rate or a higher amount of time spent viewing each page, a simple metric can provide you with an attainable goal that will get you started with web analytics.
Learn By Doing, But Keep It Simple
When I say simple, I mean really simple. You need only two things: a website being tracked by Google Analytics and a target or goal. It can be a goal centered on a really basic metric, like number of daily visitors. These examples are more for the process of measuring and using analytics as information and knowledge rather than the metric you're actually tracking.
Here are a few generic examples and a summary of how these simple targets and measurements can provide valuable insight:
Weekend Woes
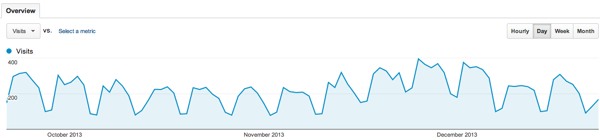
This is a snapshot of wsiworld.com's visits (per day) from September to December. One thing is immediately obvious: about every 5 days, there's a significant dip in the number of visitors our site receives. If you haven't already guessed, those two day dips are the weekends. For a business that operates Monday-Friday, this isn't unexpected. However, it's not like the site is receiving zero visitors on Saturdays and Sundays - it's getting roughly half the number of visits than the preceding week. This means that there's an opportunity for us to generate more traffic on weekends, should we decide that's an important initiative. And the reason we're aware of this opportunity? Because we're tracking and measuring our website's traffic!
So, let's say we decided that publishing and distributing one blog post per weekend was a good way to generate more traffic on Saturdays and Sundays. We'd then set a goal - let's say a 25% increase of weekend traffic - and keep an eye on the numbers to see how we're doing. It can be that simple.
More Content = More Traffic
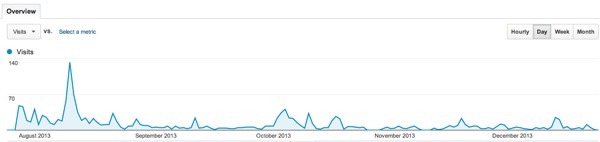
This is a six-month snapshot of a newly launched, content driven website. As you can see, this site receives much less traffic - which makes sense, since it's not really a business. The big takeaway for this website though, is that every time you see a spike in their traffic, it directly corresponds to the publication of a new piece of content. Essentially, when they publish content, it gets read for a few days by almost 100% more traffic than on a normal day with no new content. Obviously, this website is not publishing very much content - about 27 articles in five months - but if they ever decided to ramp it up, something like 50 visitors per day would be attainable in the short term with more content.
Embrace Measurement In the New Year!
We've highlighted really simple and basic examples of measurement in this post to encourage more businesses to get in tune with the cause and effect of their marketing efforts. If Santa can do it, you can too, so make a point of setting a goal and actually tracking the results in the new year.
From everybody at WSI, have a safe and enjoyable holiday, and a happy new year!


